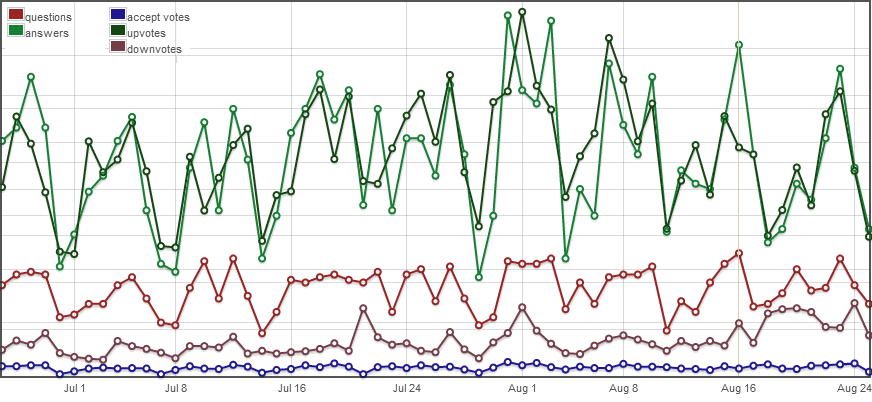
Back on August 26, 2012, in response to the question Why are there so many meta questions about how so many main questions are being downvoted or closed?, Shog9 provided this graph of changes in the numbers of questions, answers, accept votes, upvotes, and downvotes for the preceding month on EL&U:

The main limitations of the graph are (1) the (intentional) omission of labels on the y-axis, and (2) the very narrow window of time that the graph tracks (which Shog9 presumably specified in order to make recent day-to-day changes in the numbers visible and distinct).
In response to Shog9's answer, tchrist (commenting as a non-moderator) wrote "I assume that [the graph] isn't something that we can generate ourselves using the Stack Exchange Data Explorer?" and Shog9 replied, "No, no voting data in SEDE." Subsequently, however, Stack Exchange has made available to 25,000-rep site participants a set of site analytics tools that they can use to create similar charts for number of posts, number of votes, and site traffic for any period of time between August 5, 2010, and the present, with either day-to-day or week-to-week totals graphed.
These graphs yield some intriguing information. For example, the number of answers posted weekly in October 2017 appears to be, on average, only slightly more than half the number of answers posted weekly in October 2015, whereas the weekly numbers of posted questions in October 2017 average out to slightly more than four-fifths the weekly numbers for October 2015.
But because the analytics tool handles site-wide data without further differentiation, it provides no insight into questions such as "How much of the site's traffic over time has involved questions tagged as 'word-choice' or 'single-word-request'?" and "What do the weekly upvote and downvote totals look like over time if we exclude questions and answers that are tagged as 'word-choice' or 'single-word-request'?" My questions:
Do moderators have access to tools that permit this type of more-detailed data crunching and analysis using tag-based criteria?
Is there any prospect that site participants might gain access to such tools?
As the "Access to Site Analytics" page remarks,
People who run websites use data about how the site is used to make informed decisions. Since our sites are community run, we give the most engaged users special access to some of the data we collect.
It seems to me that queries tied to certain types of tag-based data might uncover interesting EL&U-specific trends that are invisible or masked in the results that the currently available analytical tools provide. They would also permit in-depth data exploration—a potentially significant consideration, given that some valuable long-time site participants have found themselves looking for ways to bolster their flagging interest in the site.
